Sunday, December 17, 2006

Delong ($0.140, 15 Dec 2006)

Delong ($0.140, 15 Dec 2006):

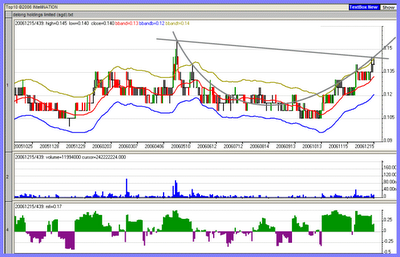
Another Cup and Handle break out?

Background:

Historical EPS ($) 0.02290
Rolling EPS ($) 0.02009
NAV ($) 0.0558
Historical PE6.114
Rolling PE 6.969
Price / NAV 2.509
Dividend ($) 0.004500
52 Weeks High 0.155
Dividend Yield (%) d 3.214
52 Weeks Low 0.105
Market Cap (M) 743.063
Issued & Paid-up Shares 5,307,591,000

The company was incorporated in Singapore on 28 July 1997 as the Group's holding company under the name of Teamsphere Pte Ltd. It changed its name to Teamsphere Limited on 17 March 1999.On 24 September 2004, Teamsphere entered into an agreement with Best Decade Holdings Limited to acquire the entire issued and paid-up share capital of Asia Paragon International Limited. The purchase consideration amounts to S$367.5 million and is to be satisfied in full by the allotment and issuance of 4.9 billion new ordinary shares. Subsequent to the acqusition, the company was renamed to Delong Holdings Limited.Delong Holdings Limited has two wholly-owned subsidiary companies:1) Asia Paragon International Limited 2) Dexin Steel Pte LtdAsia Paragon International Limited is a company incorporated in the British Virgin Islands. Asia Paragon in turn wholly owns Delong Steel Limited. Delong Steel Limited, a Wholly Foreign –Owned Enterprise ("WFOE"), is an integrated steel mill manufacturing steel billets and mid-width hot-rolled coils for both domestic consumption and export.Delong Steel Limited in turn wholly owns Delong Yuntong Steel International Trading (Beijing) Co., Ltd, agent for import and export of steel products, mineral ores and related materials, as well as investment in resources-related projects.Dexin Steel Pte Ltd is a steel trading and procurement company incorporated in Singapore where its operation is located.

Sunday, November 19, 2006

Asia Dekor ($0.160, 15 Dec 2006)

Asia Dekor ($0.160, 15 Dec 2006):

Breaking up from a symmetrical triangle? Possible near-term targets 0.18, 0.22.


Asia Dekor ($0.140, 17 Nov 2006):

AD has been range bounding for quite some time, but on 02 Nov, it suddenly shot up to $0.16 with 19m shares traded. The increased volume since then may suggest that there is renewed interest in AD:


Some trading ideas:

1. Undervalued Stock

• Closing price as at 14/11/2006 = S$0.14
• PER = 6.5 (Based on 1H-FY2007 EPS of RMB0.0534 (S$0.0107))
• Price/NAV per share = 0.8 (Based on NAV as at 30/9/2006 of RMB 0.8741 (S$0.175))
• Dividend yield = 3.14% (Based on the interim dividend of RMB0.011)

2. Strong & Positive Cashflow

• Major capital projects were completed over the past 2 years.
• EBITDA for 1H-FY2007 = RMB83.6 million

3. Proven Profit Track Record

• Strong revenue growth in 1H-FY2007
• Profit after tax stood at RMB47.3 million for 1H-FY2007


4. Strong Product Brand

• Power Dekor brand ranks 130th among China’s top 500 most valuable brands in 2006
• Power Dekor brand ranked 1st in China laminated floor sales for 8 consecutive years from 1998 to 2005


Background:
Asia Dekor Holdings Limited has been listed on the main board of the Singapore Exchange Securities Trading Limited since November 1999. It is the largest producer and distributor of laminated floor and related products in China and is recognised as one of Asia's leading floor manufacturing companies. The Group operates a 45,000 sq m factory based in Shenzhen, China, with a current maximum production capacity of 16 million sq m of laminated floor products. Joined with a new business partner, the Group operates a nationwide distribution network and up to 31 March 2003, there are more than 700 outlets in operation. The major shareholder of the Company is Hi-Power Management Ltd, an investment holding company.

Historical EPS ($) 0.02390
Rolling EPS ($) 0.02428
NAV ($) 0.1805
Historical PE 5.858
Rolling PE 5.766
Price / NAV 0.776
Dividend ($) 0.00524452
Weeks High 0.215
Dividend Yield (%) 3.74652
Weeks Low 0.085
Market Cap (M) 124.816
Issued & Paid-up Shares c891,544,000

Friday, November 10, 2006

BioTreat Update ($0.515, 10 Nov 2006)

BioTreat Update ($0.515, 10 Nov 2006):

(1) Before that fateful plunge on 30 Aug 2006 (Circle):

Some bearish signs started to appear sometime in mid-August:

- The initial formation of a Death Cross
- Detiriorating Stochastics and William's %r


(2) Current conditions (Rounded Rectangle):

- There are too many unpleasant news (Textboxes with red titlebars)
- Price trending downwards
- All indicators are pointing down
- Possible support at $0.39 (Blue Lower Price Band Line in Chart 1)


Note: Click on picture for an enlarged view.


BioTreat ($0.845, 31 Aug 2006):

There are tell-tale signs of bearishness long before the plunge on 30 Aug 2006:

- Formation of the Death Cross on 17 Aug, indicating the start of the bearish downtrend (Circled, Chart 3 below)
- The Bearishness signal continued to rise (Chart 3)
- The Bullishness and other signals continued to fall (Charts 3, 6, 7 & 8)

Price Targets:

- DBS: $0.70, Sell
- CIMB: $1.11, Sell
- CitiGroup: Sell
- SIA Research: $0.79 (http://forum.shareinvestor.com/forum/attachment.php?attachmentid=6755&d=1157076366)

Friday, October 06, 2006

A Comparison Among 3 Groups of Stocks (06 Oct 2006)

A Comparison Among 3 Groups of Stocks (06 Oct 2006):

15 Aug 2006 was used as the reference point for the comparison, as it was the date when the 3 groups started to go different ways:

1. The China Stock Group (Black, comprising the Prime Partner's 25 China Index Stocks) had bottomed up and is testing its current resistance level;

2. The Precision Plastic Group (Blue) has been rising. The more outstanding ones are Meiban (Bullishness 25, Bearishness 8) and Hi-p (Bullishness 29, Bearishness 11).

3. The China Pharma Group (Red) continued to fall. In this group, Star Pharm had made a noticeable recovery towards the last couple of trading days but the volume was low.

Sunday, October 01, 2006

PrimePartner's China Index Components (29 Sep 2006)

PrimePartner's China Index Components (29 Sep 2006):

Their Group Average Price and Group Total Trade are shown in Charts 1 and 2 respectively:

(Click to enlarge view)


As a group, their Group Average Price has been range-bounding recently, and is currently at its resistance level (Chart 1 above) with Group Total Trade declining (Chart 2). Although only the first few stocks have been bullish in the past 2 weeks, there could be hidden gems among them waiting to be discovered in the near future:

beauty china holdings limited (sgd)
cosco corporation (s) ltd (sgd)
pine agritech limited (sgd)
sp chemicals ltd (sgd)
sinomem technology limited (sgd)
midas hldgs limited (sgd)
people's food holdings limited (sgd)
asiapharm group ltd (sgd)
celestial nutrifoods limited (sgd)
fung choi media group limited (sgd)
china merchants hldgs(pacific) (sgd)
china paper holdings limited (sgd)
cht (holdings) ltd. (sgd)
united food holdings limited (sgd)
bio-treat technology limited (sgd)
ferrochina limited (sgd)
fibrechem technologies limited (sgd)
china sun biochem tech gp co. (sgd)
china petrotech holdings ltd (sgd)
china dairy group ltd (sgd)
memtech international ltd (sgd)
delong holdings limited (sgd)
china flexible pack hldg ltd (sgd)
full apex (holdings) limited (sgd)
united envirotech ltd (sgd)

Note: The stocks were assigned equal weightings in the above computation.

Friday, September 08, 2006

China Pharma Stocks Update (27 Sep 2006)

China Pharma Stocks Update (27 Sep 2006):

China pharma stocks (blue) continue to drift lower and China textile-related stocks (red) started to show signs of weakness:


Note: Colored sticky notes are now available in the latest version of Top10. Click here to Download a free trial copy and visit this site for illustrations on how to use the software.


China Pharma Stocks Update (08 Sep 2006)

Most of the China stocks either rise or stay stagnant in August, with the exception of the Pharma Group which continues to slide (light brown color in Chart 1):


Counters in this group are (in order of their Bearishness):

  1. AsiaPharm (55, Shown in chart below)
  2. C&O (36)
  3. Reyoung (29)
  4. Star (16)
  5. Tianjin (16)
  6. Pharmesis (0)

AsiaPharm's share price did a Death Cross on 04 Aug (Chart 3 above) and its Bearishness signal has been rising while its Bullishness signal stays close to zero since then.


China Pharma Stocks (01 Sep 2006)

Both Group Average Price (Chart 1) and Group Total Trade (Chart 2) continue to fall since April and early May:

Saturday, September 02, 2006

Download Available (02 Sep 2006)

Download Top10:
Version 3.0.6, Released 03 Sep 2006 (with stock data)


SGX Stocks Blog:
http://intellination.blogspot.com

China Pharma Stocks (01 Sep 2006)

China Pharma Stocks (01 Sep 2006)

Both Group Average Price (Chart 1) and Group Total Trade (Chart 2) continue to fall since April and early May:

The group consists of:
- Star
- Reyoung
- AsiaPharm
- Tianjin
- C&O
- Pharmesis

Sunday, August 13, 2006

Divergence Between Price and Trade (11 Aug 2006)

Group Average Price went down in an upward trend (Chart 1), whereas Group Total Trade continues to fall (Chart 2). Divergence between the two may indicate weakness in the price trend in the near future:

Saturday, August 05, 2006

China Essence Update ($0.630, 04 Aug 2006)

Since it was mentioned on the 25 July with the "Three White Soldier" candlestick pattern (Point A), its share price has been falling till now. A Gravestone Doji was spotted recently (Point B) and that adds more bearishness to its downtrend together with other bearish indicators:

Wednesday, August 02, 2006

China Stocks - Update 02 Aug 2006

Two groups of China Stocks were compared in the chart below, the first is in red and the second in black. The top chart shows their Group Average Price, which is in a long-term uptrend but seems to be turning downward for the short term. The second chart shows their Group Total Trades done:

Saturday, July 29, 2006

Extreme China Stocks

The performances of 60 EXTREME China counters are summarized herein. The counters offer great opportunities but please trade carefully and observe the warning notice below.

(1) The 30 Extreme Bullish China Counters -


(2) The 30 Extreme Bearish China Counters -


Remarks:
1. For the Extreme 30 China stocks, please visit:
China-Stocks.blogspot.com

2. To download a free trial copy of Top10, visit:
www.INtelliNATION.com

3. Use the "Exclude Warrants" option to remove listing of warrants

Thursday, July 27, 2006

China Stocks (27 July 2006)

The Group Average Price of China Stock group is in an uptrend channel, but may face resistance in short term and turn downward (Chart 1 in black color). The Pharma group is trending down (in red color) whereas the textile group (in blue color) is unsure of its direction:

Tuesday, July 25, 2006

FerrorChinia ($0.795, 25 July 2006)

Candlestick chart resembles that of an Evening Doji Star with Bearish Engulfing. Tech indicators aren't that great, bull and bear are fighting it out (Chart 3), and Stochastics are turning downward (Chart 7). Currently ranked 4th most bearish among the Top10 China hot stocks. Perhaps it is not a good time to enter. Click to see details.

China Essence - Hot Potatoes (25 July 2006)

China Essence ($0.650, 25 July 2006)

Ranked 8th top volume today, dropped $0.015 from yesterday's close. Candlestick chart resembles that of a "Three White (Green) Soldiers" pattern which is bearish:


The best entry point for China Essence was on 14 June at around the "Golden Cross" with the full set of confirming bullish indicators.

Monday, July 24, 2006

List of China Stocks (24 July 2006)

List of China Stocks listed on SGX as of 24 July 2006: (Click to see details)

Tools for China Stocks - Candy

Candy - A Candlestick Handy Guide allows users to look for the nearest-matched candlestick patterns and deduce the next possible moves of the stock price:


Download a free copy at this link.

Tools for China Stocks - Top10

Top10 - A stock-charting and stock-picking tool for processing inidividual and groups of stocks, with built-in downloader:


Many tasks can be accomplished with just a few clicks of the mouse. Download a free trial copy by clicking on this link.